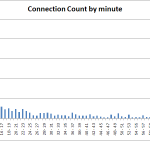
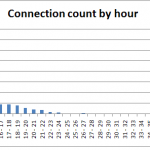
This is how bad my ADSL connection was
For backround on the story, read more about it here:
Part 1.
Part 2.
Here are some graphs showing the frequency of the connection. The first graph is connections by minute for the first hour, the second is connections by hour for the first 40 hours.
blog comments powered by Disqus
Published
10 September 2009

